FILIPINO 2040
Aspirations, Values and Principles of Filipino People
-
1 Background of the Study
- 1.1 Rationale
- 1.2 Objective
-
2 Research Approach
- 2.1 Methodology
- 2.2 Target respondents
- 2.3 Sampling
- 2.4 Sample sizes and survey areas
- 2.5 Margin of error
- 2.6 Response rate
-
3 Questionnaire
-
4 Technical Notes
- 4.1 Socio-economic class
- 4.2 Significance test
- 1.1 Rationale
- 1.2 Objective
The National Economic and Development Authority (NEDA) is developing a long-term vision for the Philippines and the Filipino people, which is envisioned to be a basis of unity among Filipinos, a guide for development planning across administrations, as well as for international development assistance for the next 25 years. It is also intended to be a useful reference that should influence electoral platforms and that should set the terms of debate in 2016 and beyond. The national long-term vision intends to help successive administrations remain focused on the country’s long-term goals, even as they respond to short- and medium-term needs and conditions. This can be achieved by ensuring that the national vision is genuinely owned by citizens who will reach their peak productive years between 2015 and 2040, and who will oblige government officials to stay on the course towards long-term development.
To ensure widespread stakeholder engagement, a national survey is deemed important that will capture the aspirations, values and principles of the Filipino people.
The survey research intends to solicit responses that reflect the aspirations, values and principles of the Filipino people.
- 2.1 Methodology
- 2.2 Target respondents
- 2.3 Sampling
- STAGE 1:
- The Philippines is divided into the 18 geographical regions. Using the 2010 Census of Population projected to 2015*, the sample size will be distributed proportionately across regions to ensure a well-represented sample that reflects nationwide proportions.
- STAGE 2:
- Each specific region is then represented by different provinces from its domain. Proportionate sampling will also be employed to all provinces for a more accurate coverage (except for Batanes which has a considerably low population). The urban and rural split from the Philippine National Statistical Coordination Board (NSCB) definition will be followed for each province within each specific region to mirror the urban-rural proportions nationwide.
- Based on NSCB definition, “urban” areas fall under the following categories:
- In their entirety, all municipal jurisdictions which, whether designated chartered cities, provincial capital or not, have a population density of at least 1,000 persons per square kilometer: all barangays;
- Poblacions or central districts of municipalities and cities which have a population density of at least 500 persons per square kilometer;
- Poblacions or central districts not included in (1) and (2) regardless of the population size which have the following:
- street pattern or network of streets in either parallel or right angel orientation;
- at least six establishments (commercial, manufacturing, recreational and/or personal services)
- at least three of the following: a town hall, church or chapel with religious service at least once a month; a public plaza, park or cemetery; a market place, or building, where trading activities are carried on at least once a week; or a public building, like a school, hospital, periculture and health center or library.
- Barangays having at least 1,000 inhabitants which meet the conditions set forth in (3) above and where the occupation of the inhabitants is predominantly non-farming or fishing.
- Sample sizes and survey areas
- Risk Areas: Abra, Sulu, Basilan
Given that Abra from CAR and Basilan and Sulu from ARMM were considered critical areas, sample for these areas were proportionately redistributed among the remaining provinces within their respective regions under the assumption that provinces within regions are in some ways homogeneous in their physical, demographical, and political characteristics. In doing this redistribution, we will be able to preserve the general profile of the region where they belong. - Small Population Size: Apayao, Batanes, Siquijor, Camiguin, Dinagat Islands Provinces with small population such as Apayao (CAR), Batanes (Region 2), Siquijor (Region 7), Camiguin (Region 10), and Dinagat Islands (CARAGA) were also not included in the sample. All of which have population of 150,000 or less and the small population does not merit inclusion in the sampling distribution given the proportionate sampling method. Same as with the provinces that were considered critical, spots were re-allocated to the other provinces within their respective regions.
- Margin of error
- Summarized in Table 3 are the final result of the total sampled households. It shows that to achieve the 10,000 completed interviews, 20,406 households were knocked. Of the 20,406 households knocked, 4,362 gave no reply or door locked and 1,831 were not eligible primarily because no household member fits the age requirement. The response rate among eligible interviews was 70.4%.
Face-to-face personal interviews with the use of tablets
With two (2) valid call backs – one during weekday, one during weekend
Males/ Females, 15-50 years old, from ABCDE income homes
Multi-stage area probability sampling
A total of 10,000 interviews in Nationwide Urban/ Rural areas. Breakdown of which is on the next two pages.
| CENSUS 2010 PROJECTED 2015 | SPOTS | INTERVIEWS | |||||||||||||
|---|---|---|---|---|---|---|---|---|---|---|---|---|---|---|---|
| TOTAL | Urban | Keycities | Towns | RURAL | TOTAL | Urban | Keycities | Towns | RURAL | TOTAL | Urban | Keycities | Towns | RURAL | |
| 46% | 33% | 13% | 54% | 46% | 33% | 13% | 54% | 46% | 33% | 13% | 54% | ||||
| Total Philippines | 101,699,001 | 46,696,162 | 33,234,840 | 13,461,322 | 55,002,839 | 1,000 | 462 | 330 | 132 | 538 | 10,000 | 4,620 | 3,300 | 1,320 | 5,380 |
| NCR | 12,989,298 | 12,989,298 | 12,989,298 | 0 | 0 | 128 | 128 | 128 | 0 | 0 | 1,280 | 1,280 | 1,280 | 0 | 0 |
| CAR | 1,760,832 | 470,449 | 362,895 | 107,554 | 1,290,383 | 17 | 5 | 4 | 1 | 12 | 170 | 50 | 40 | 10 | 120 |
| BENGUET | 804,959 | 404,485 | 304,030 | 100,454 | 400,474 | 9 | 4 | 3 | 1 | 5 | 90 | 40 | 30 | 10 | 50 |
| KALINGA | 216,981 | 43,334 | 43,334 | 0 | 173,647 | 3 | 1 | 1 | 0 | 2 | 30 | 10 | 10 | 0 | 20 |
| IFUGAO | 207,779 | 2,495 | 2,495 | 0 | 205,284 | 3 | 0 | 0 | 0 | 3 | 30 | 0 | 0 | 0 | 30 |
| MOUNTAIN PROVINCE | 161,411 | 9,125 | 3,172 | 5,953 | 152,286 | 2 | 0 | 0 | 0 | 2 | 20 | 0 | 0 | 0 | 20 |
| REGION 1 | 5,049,265 | 640,962 | 374,072 | 266,890 | 4,408,303 | 50 | 6 | 4 | 2 | 44 | 500 | 60 | 40 | 20 | 440 |
| PANGASINAN | 2,971,172 | 503,545 | 283,925 | 219,620 | 2,467,627 | 29 | 5 | 3 | 2 | 24 | 290 | 50 | 30 | 20 | 240 |
| LA UNION | 787,891 | 91,484 | 54,599 | 36,886 | 696,407 | 8 | 1 | 1 | 0 | 7 | 80 | 10 | 10 | 0 | 70 |
| ILOCOS SUR | 693,210 | 18,154 | 12,393 | 5,761 | 675,056 | 7 | 0 | 0 | 0 | 7 | 70 | 0 | 0 | 0 | 70 |
| ILOCOS NORTE | 596,992 | 27,779 | 23,156 | 4,623 | 569,213 | 6 | 0 | 0 | 0 | 6 | 60 | 0 | 0 | 0 | 60 |
| REGION 2 | 3,460,194 | 400,466 | 243,243 | 157,223 | 3,059,728 | 34 | 4 | 3 | 1 | 30 | 340 | 40 | 30 | 10 | 300 |
| ISABELA | 1,602,401 | 241,226 | 157,165 | 84,061 | 1,361,175 | 16 | 3 | 2 | 1 | 13 | 160 | 30 | 20 | 10 | 130 |
| CAGAYAN | 1,196,851 | 97,760 | 70,695 | 27,065 | 1,099,091 | 12 | 1 | 1 | 0 | 11 | 120 | 10 | 10 | 0 | 110 |
| NUEVA VIZCAYA | 451,465 | 47,496 | 6,992 | 40,503 | 403,969 | 4 | 0 | 0 | 0 | 4 | 40 | 0 | 0 | 0 | 40 |
| QUIRINO | 192,806 | 12,312 | 6,718 | 5,594 | 180,494 | 2 | 0 | 0 | 0 | 2 | 20 | 0 | 0 | 0 | 20 |
| REGION 3 | 11,275,841 | 5,859,121 | 2,504,360 | 3,354,762 | 5,416,720 | 111 | 58 | 25 | 33 | 53 | 1,110 | 580 | 250 | 330 | 530 |
| BULACAN | 3,346,017 | 2,372,843 | 814,241 | 1,558,602 | 973,174 | 32 | 23 | 18 | 15 | 9 | 320 | 230 | 180 | 150 | 90 |
| PAMPANGA | 2,609,406 | 1,609,716 | 842,112 | 767,604 | 999,690 | 25 | 15 | 8 | 7 | 10 | 250 | 150 | 80 | 70 | 100 |
| NUEVA ECIJA | 2,122,103 | 578,991 | 306,635 | 272,357 | 1,543,112 | 21 | 6 | 3 | 3 | 15 | 210 | 60 | 30 | 30 | 150 |
| TARLAC | 1,389,299 | 481,554 | 208,333 | 273,221 | 907,745 | 14 | 5 | 2 | 3 | 9 | 140 | 50 | 20 | 30 | 90 |
| ZAMBALES | 829,307 | 427,318 | 265,210 | 162,109 | 401,989 | 9 | 5 | 3 | 2 | 4 | 90 | 50 | 30 | 20 | 40 |
| BATAAN | 763,137 | 367,096 | 51,639 | 315,456 | 396,041 | 8 | 4 | 1 | 3 | 4 | 80 | 40 | 10 | 30 | 40 |
| AURORA | 216,572 | 21,603 | 16,191 | 5,412 | 194,969 | 2 | 0 | 0 | 0 | 2 | 20 | 0 | 0 | 0 | 20 |
| REGION 4A | 14,708,207 | 8,897,516 | 4,603,595 | 4,293,921 | 5,810,691 | 145 | 88 | 46 | 42 | 57 | 1450 | 880 | 460 | 420 | 570 |
| CAVITE | 3,782,042 | 2,388,305 | 1,462,857 | 925,448 | 1,393,737 | 38 | 24 | 15 | 9 | 14 | 380 | 240 | 150 | 90 | 140 |
| LAGUNA | 3,111,647 | 2,235,826 | 1,574,483 | 661,342 | 875,821 | 31 | 22 | 16 | 6 | 9 | 310 | 220 | 160 | 60 | 90 |
| RIZAL | 2,997,116 | 2,779,410 | 815,547 | 1,963,863 | 217,706 | 29 | 27 | 8 | 19 | 2 | 290 | 270 | 80 | 190 | 20 |
| BATANGAS | 2,655,862 | 867,775 | 492,630 | 375,145 | 1,788,087 | 26 | 9 | 5 | 4 | 17 | 260 | 90 | 50 | 40 | 170 |
| QUEZON | 2,161,540 | 626,200 | 258,078 | 368,122 | 1,535,340 | 21 | 6 | 2 | 4 | 15 | 210 | 60 | 20 | 40 | 150 |
| REGION 4B | 3,006,262 | 685,617 | 221,298 | 464,319 | 2,320,645 | 29 | 7 | 2 | 5 | 22 | 290 | 70 | 20 | 50 | 220 |
| PALAWAN | 1,141,067 | 383,675 | 162,569 | 221,105 | 757,392 | 11 | 4 | 2 | 2 | 7 | 110 | 40 | 20 | 20 | 70 |
| ORIENTAL MINDORO | 843,402 | 88,481 | 26,320 | 62,161 | 754,921 | 8 | 1 | 0 | 1 | 7 | 80 | 10 | 0 | 10 | 70 |
| OCCIDENTAL MINDORO | 494,260 | 209,107 | 28,055 | 181,053 | 285,153 | 5 | 2 | 0 | 2 | 3 | 50 | 20 | 0 | 20 | 30 |
| ROMBLON | 294,300 | 2,726 | 2,726 | 0 | 291,574 | 3 | 0 | 0 | 0 | 3 | 30 | 0 | 0 | 0 | 30 |
| MARINDUQUE | 233,233 | 1,628 | 1,628 | 0 | 231,605 | 2 | 0 | 0 | 0 | 2 | 20 | 0 | 0 | 0 | 20 |
| REGION 5 | 5,829,362 | 894,271 | 577,019 | 317,253 | 4,935,091 | 57 | 9 | 6 | 3 | 48 | 570 | 90 | 60 | 30 | 480 |
| CAMARINES SUR | 1,974,844 | 382,675 | 266,780 | 115,895 | 1,592,169 | 20 | 4 | 3 | 1 | 16 | 200 | 40 | 30 | 10 | 160 |
| ALBAY | 1,311,177 | 239,413 | 145,442 | 93,971 | 1,071,764 | 13 | 3 | 2 | 1 | 10 | 130 | 30 | 20 | 10 | 100 |
| MASBATE | 906,264 | 80,363 | 50,355 | 30,008 | 825,901 | 8 | 0 | 0 | 0 | 8 | 80 | 0 | 0 | 0 | 80 |
| SORSOGON | 790,550 | 67,545 | 50,543 | 17,001 | 723,005 | 7 | 0 | 0 | 0 | 7 | 70 | 0 | 0 | 0 | 70 |
| CAMARINES NORTE | 583,147 | 117,131 | 57,513 | 59,618 | 466,016 | 7 | 2 | 1 | 1 | 5 | 70 | 20 | 10 | 10 | 50 |
| CATANDUANES | 263,380 | 7,144 | 6,385 | 759 | 256,236 | 2 | 0 | 0 | 0 | 2 | 20 | 0 | 0 | 0 | 20 |
| REGION 6 | 4,500,638 | 616,495 | 439,472 | 177,023 | 3,884,143 | 44 | 6 | 4 | 2 | 38 | 440 | 60 | 40 | 40 | 380 |
| ILOILO | 2,400,413 | 318,195 | 245,950 | 72,245 | 2,082,218 | 23 | 3 | 2 | 1 | 20 | 230 | 30 | 20 | 10 | 20 |
| CAPIZ | 754,900 | 140,313 | 113,279 | 27,034 | 614,587 | 7 | 1 | 1 | 0 | 6 | 70 | 10 | 10 | 0 | 60 |
| ANTIQUE | 586,783 | 44,482 | 22,756 | 21,726 | 542,301 | 5 | 0 | 0 | 0 | 5 | 50 | 0 | 0 | 0 | 50 |
| AKLAN | 583,697 | 105,456 | 50,705 | 54,751 | 478,241 | 7 | 2 | 1 | 1 | 5 | 70 | 20 | 10 | 10 | 50 |
| GUIMARAS | 174,845 | 8,049 | 6,782 | 1,267 | 166,796 | 2 | 0 | 0 | 0 | 2 | 20 | 0 | 0 | 0 | 20 |
| REGION 7 | 6,067,090 | 2,873,736 | 2,279,594 | 594,142 | 3,193,354 | 59 | 28 | 22 | 6 | 31 | 590 | 280 | 220 | 600 | 310 |
| CEBU | 4,653,710 | 2,731,575 | 2,187,572 | 544,003 | 1,922,135 | 45 | 26 | 21 | 5 | 19 | 450 | 260 | 210 | 50 | 190 |
| BOHOL | 1,317,194 | 137,481 | 90,337 | 47,144 | 1,179,713 | 14 | 2 | 1 | 1 | 12 | 140 | 20 | 10 | 10 | 120 |
| REGION 8 | 4,372,452 | 381,297 | 266,977 | 114,320 | 3,991,155 | 43 | 4 | 3 | 1 | 39 | 430 | 40 | 30 | 10 | 390 |
| LEYTE | 1,897,348 | 253,452 | 145,566 | 107,886 | 1,643,896 | 19 | 3 | 2 | 1 | 16 | 190 | 30 | 20 | 10 | 160 |
| SAMAR (WESTERN SAMAR) | 784,235 | 75,297 | 74,316 | 981 | 708,938 | 8 | 1 | 1 | 0 | 7 | 80 | 10 | 10 | 0 | 70 |
| NORTHERN SAMAR | 638,922 | 24,968 | 21,765 | 3,203 | 613,954 | 6 | 0 | 0 | 0 | 6 | 60 | 0 | 0 | 0 | 60 |
| EASTERN SAMAR | 458,166 | 5,619 | 5,619 | 0 | 452,547 | 4 | 0 | 0 | 0 | 4 | 40 | 0 | 0 | 0 | 40 |
| SOUTHERN LEYTE | 420,120 | 13,864 | 11,614 | 2,250 | 406,256 | 4 | 0 | 0 | 0 | 4 | 40 | 0 | 0 | 0 | 40 |
| BILIRAN | 173,661 | 8,096 | 8,096 | 0 | 165,565 | 2 | 0 | 0 | 0 | 2 | 20 | 0 | 0 | 0 | 20 |
| REGION 18 (NEGROS ISLAND REGION) | 4,469,220 | 2,427,307 | 1,890,409 | 536,898 | 2,041,913 | 45 | 24 | 19 | 5 | 21 | 450 | 240 | 190 | 50 | 210 |
| NEGROS OCCIDENTAL | 3,096,040 | 2,013,404 | 1,607,904 | 405,500 | 1,082,636 | 31 | 20 | 16 | 4 | 11 | 310 | 200 | 160 | 40 | 110 |
| NEGROS ORIENTAL | 1,373,180 | 413,903 | 282,505 | 131,398 | 959,277 | 14 | 4 | 3 | 1 | 10 | 140 | 40 | 30 | 10 | 100 |
| REGION 9 | 3,743,794 | 1,279,531 | 1,088,026 | 191,505 | 2,464,263 | 37 | 13 | 11 | 2 | 24 | 370 | 130 | 110 | 20 | 240 |
| ZAMBOANGA DEL SUR | 1,963,039 | 999,172 | 915,929 | 83,243 | 963,867 | 19 | 10 | 9 | 1 | 9 | 190 | 100 | 90 | 10 | 90 |
| ZAMBOANGA DEL NORTE | 1,033,561 | 147,720 | 110,326 | 37,394 | 885,841 | 10 | 1 | 1 | 0 | 9 | 100 | 10 | 10 | 0 | 90 |
| ZAMBOANGA SIBUGAY | 633,916 | 101,870 | 31,003 | 70,868 | 532,046 | 6 | 1 | 0 | 1 | 5 | 60 | 10 | 0 | 10 | 50 |
| City of Isabela | 113,278 | 30,769 | 30,769 | 0 | 82,509 | 2 | 1 | 1 | 0 | 1 | 20 | 10 | 10 | 0 | 10 |
| REGION 10 | 4,760,960 | 1,971,878 | 1,339,424 | 632,453 | 2,789,082 | 47 | 19 | 13 | 6 | 28 | 470 | 190 | 130 | 60 | 280 |
| MISAMIS ORIENTAL | 1,588,311 | 868,872 | 667,869 | 201,003 | 719,439 | 16 | 9 | 7 | 2 | 7 | 160 | 90 | 70 | 20 | 70 |
| BUKIDNON | 1,437,932 | 602,636 | 244,126 | 358,510 | 835,296 | 14 | 5 | 2 | 3 | 9 | 140 | 50 | 20 | 30 | 90 |
| LANAO DEL NORTE | 1,032,653 | 389,149 | 325,273 | 63,876 | 643,504 | 11 | 4 | 3 | 1 | 7 | 110 | 40 | 30 | 10 | 70 |
| MISAMIS OCCIDENTAL | 613,019 | 96,034 | 86,970 | 9,064 | 516,985 | 6 | 1 | 1 | 0 | 5 | 60 | 10 | 10 | 0 | 5 |
| REGION 11 | 4,929,980 | 2,933,349 | 2,051,011 | 882,338 | 1,996,631 | 48 | 29 | 20 | 9 | 19 | 480 | 290 | 200 | 90 | 190 |
| DAVAO DEL SUR | 2,243,660 | 1,653,637 | 1,520,225 | 133,412 | 590,023 | 22 | 16 | 15 | 1 | 6 | 220 | 160 | 150 | 10 | 60 |
| DAVAO DEL NORTE | 1,066,396 | 681,255 | 410,056 | 271,199 | 385,141 | 11 | 7 | 4 | 3 | 4 | 110 | 70 | 40 | 30 | 40 |
| COMPOSTELA VALLEY | 747,994 | 322,659 | 36,814 | 285,844 | 425,335 | 7 | 3 | 0 | 3 | 4 | 70 | 30 | 0 | 30 | 40 |
| DAVAO ORIENTAL | 557,622 | 196,447 | 83,915 | 112,532 | 361,175 | 5 | 2 | 1 | 1 | 3 | 50 | 20 | 10 | 10 | 30 |
| DAVAO OCCIDENTAL | 314,308 | 79,351 | 0 | 79,351 | 234,957 | 3 | 1 | 0 | 1 | 2 | 30 | 10 | 0 | 10 | 20 |
| REGION 12 | 4,650,574 | 2,176,107 | 1,299,255 | 876,852 | 2,474,467 | 46 | 22 | 13 | 9 | 24 | 460 | 220 | 130 | 90 | 240 |
| TOTAL COTABATO | 1,737,029 | 634,653 | 370,867 | 263,786 | 1,102,376 | 18 | 7 | 4 | 3 | 11 | 180 | 70 | 40 | 30 | 110 |
| COTABATO (NORTH COTABATO) | 1,387,004 | 331,187 | 67,401 | 263,786 | 1,055,817 | 15 | 4 | 1 | 3 | 11 | 150 | 40 | 10 | 30 | 110 |
| COTABATO CITY | 350,025 | 303,466 | 303,466 | 0 | 46,559 | 3 | 3 | 3 | 0 | 0 | 30 | 30 | 30 | 0 | 0 |
| SOUTH COTABATO | 1,520,323 | 1,039,943 | 718,468 | 321,475 | 480,380 | 15 | 10 | 7 | 3 | 5 | 150 | 100 | 70 | 30 | 50 |
| SULTAN KUDARAT | 843,201 | 286,965 | 148,259 | 138,707 | 556,236 | 7 | 2 | 1 | 1 | 5 | 70 | 20 | 10 | 10 | 50 |
| SARANGANI | 550,021 | 214,546 | 61,662 | 152,885 | 335,475 | 6 | 3 | 1 | 2 | 3 | 60 | 30 | 10 | 20 | 30 |
| CARAGA | 2,615,503 | 717,554 | 480,104 | 237,451 | 1,897,949 | 26 | 7 | 5 | 2 | 19 | 260 | 70 | 50 | 20 | 190 |
| AGUSAN DEL SUR | 710,989 | 192,739 | 70,048 | 122,691 | 518,250 | 7 | 2 | 1 | 1 | 5 | 70 | 20 | 10 | 10 | 50 |
| AGUSAN DEL NORTE | 692,029 | 252,701 | 218,353 | 34,348 | 439,328 | 7 | 2 | 2 | 0 | 5 | 70 | 20 | 20 | 0 | 50 |
| SURIGAO DEL SUR | 593,359 | 157,216 | 96,898 | 60,318 | 436,143 | 7 | 2 | 1 | 1 | 5 | 70 | 20 | 10 | 10 | 50 |
| SURIGAO DEL NORTE | 481,036 | 106,330 | 89,048 | 17,281 | 374,706 | 5 | 1 | 1 | 0 | 4 | 50 | 10 | 10 | 0 | 40 |
| ARMM | 3,509,529 | 481,206 | 224,788 | 256,418 | 3,028,323 | 34 | 5 | 2 | 3 | 29 | 340 | 50 | 20 | 30 | 290 |
| MAGUINDANAO | 1,025,776 | 168,259 | 17,656 | 150,603 | 857,517 | 14 | 2 | 0 | 2 | 12 | 140 | 20 | 0 | 20 | 120 |
| LANAO DEL SUR | 1,007,865 | 41,892 | 37,483 | 4,409 | 965,973 | 14 | 1 | 1 | 0 | 13 | 140 | 10 | 10 | 0 | 130 |
| TAWI-TAWI | 390,810 | 65,793 | 35,588 | 30,205 | 325,017 | 6 | 2 | 1 | 1 | 4 | 60 | 20 | 10 | 10 | 40 |
Margin of error for Total read is +/- 0.98%. Corresponding MOE for each area of interest follows:
| BASE (n) | MOE (+/- %) | |
| TOTAL PHILS. | 10000 | 0.98 |
| Urban | 4620 | 1.44 |
| Rural | 5380 | 1.34 |
| LUZON (NET) | 5710 | 1.30 |
| NCR | 1280 | 2.74 |
| CAR | 170 | 7.52 |
| REGION 1 | 500 | 4.38 |
| REGION 2 | 340 | 5.31 |
| REGION 3 | 1110 | 2.94 |
| REGION 4A | 1450 | 2.57 |
| REGION 4B | 290 | 5.75 |
| REGION 5 | 570 | 4.10 |
| VISAYAS (NET) | 1910 | 2.24 |
| REGION 6 | 440 | 4.67 |
| REGION 7 | 590 | 4.03 |
| REGION 8 | 430 | 4.73 |
| REGION 18 | 450 | 4.62 |
| MINDANAO (NET) | 2380 | 2.01 |
| REGION 9 | 370 | 5.09 |
| REGION 10 | 470 | 4.52 |
| REGION 11 | 480 | 4.47 |
| REGION 12 | 460 | 4.57 |
| CARAGA | 260 | 6.08 |
| ARMM | 340 | 5.31 |
| TOTAL 20,406 | |
|---|---|
| A. COMPLETED INTERVIEWS | 10,000 |
| B. ELIGIBLE, NON-INTERVIEW | 4,213 |
| B1. Outright refusal | 4,213 |
| C. UNKNOWN ELIGIBILITY, NON-INTERVIEW | 4,362 |
| C1. No reply | 2,718 |
| C2. Door/ Gate locked | 1,644 |
| D. NOT ELIGIBLE | 1,831 |
| D1. Terminate – Not permanent HH member (Maid only, Boarder only) | 68 |
| D2. Terminate – Company affiliation | 478 |
| D3. Terminate – Age (over/ under age) | 1,285 |
| RESPONSE RATE [A/(A+B)] | 70.4% |
This outlines the general structure of the questionnaire.
SCREENER
MAIN QUESTIONNAIRE
Part A. Vision
- General Future
- Standard of Living
- Health
- Education
- Employment
- Urbanization
- Economy
- Justice and Governance
- Peace and Security
- Cultural Diversity
- Education B4. Employment
- Justice and Governance B6. Peace and Security
- Poverty and Hunger
Part B. Present Situation B1. Standard of Living B2. Health
- 4.1 Socio-economic class
In analyzing the results, the respondents were grouped based on their socio-economic status. This classification was based on the market research industry’s (Marketing and Opinion Research Society of the Philippines, MORES) standards.
Seven factors were considered in classifying socio-economic status:
- Durability of the home
- Indoor quality: House maintenance
- Neighborhood: Location of the house
- Education of the Household Head
- Occupation of the Household Head
- Facilities of the house
- Estimated household monthly income
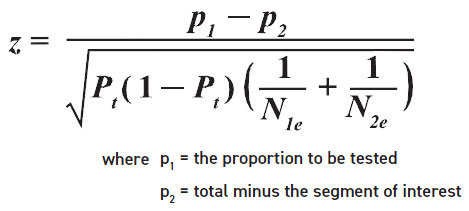
- Significance test
| factors | AB | upper c | broad c | d | e |
|---|---|---|---|---|---|
| Durability of Home | Heavy high quality materials (concrete, wood and concrete, or first class wood, bricks) Permanent | Of good quality materials (wood and concrete or first class wood); generally permanent | Of mixed light and heavy materials, semi-permanent | Of light and cheap materials, poorly constructed; semi-permanent | Temporary structure barong-barong type or a poorly constructed one room affair |
| Indoor quality: house maintenance | Well-painted; not in need of repair | Well-painted but may need a new coat of paint and some minor repairs | Painted but need new coat of paint and need some repairs | Generally unpainted and badly in need of repair | Unpainted and dilapidated |
| Neighborhood: Location of the house | Located in an exclusive subdivision/expensive neighborhood, enclaves. Townhouses and condominiums. If in mixed neighborhood it must have a fence, at least | Maybe found in mixed neighborhood of larger and smaller houses, with predominantly larger houses | Generally found in mixed neighborhood with houses larger or smaller than it | Found mostly in neihborhoods of houses with generally the same size, with occasional large houses | Located generally slum district interior or rural houses |
| Education of the household head | Graduate of exclusive colleges and universities including university of the philippines | Graduate of state colleges and universities | Some college education but did not graduate/technical training/vocational | Some high school education | Elementary school graduate or less |
| Occupation of household head | Moderate to big businessman, top executive. Mayve established or approaching a senior executive level or a professional. Middle to senior national regional or city official | Junior executive or a young professional with moderate to high net value. Maybe approaching a senior executive level or a professional. He may be a provincial town official | Maybe a young/starting professional or semi professional or a middle level supervisor. Small businessman or small farm-owner, technical or skilled overseas worker. Generally a skilled or white collar worker | Lowly paid white collar worker or skilled worker. Lowland farmer, tanant or foreman. Unskilled overseas worker. may have a small informal business | Farmland, fisherman or unskilled worker, vendor. Not permanently employed or no regular income; engaged in odd jobs such as plumbing, repairs, masonry, etc. |
| Facilities of the house | More than 10 facilities, and has a new car (not more than 5 years old) | 8-10 facilities, and has a car or a jeep > 10 with jeep >10 w/out jeep/car | 5-7 facilities, with or without a car or jeep 8-10 w/out jeep/car | 2-4 facilities | 0-1 facility |
| Estimated household monthly income | A- Php 100,000 & up B- Php50 – 99,000 |
Php30,001 – Php50,000 |
Php15,001 – Php30,000 |
Php 8,001 – Php 15,000 |
Below Php 8,000 |
| Facilities considered: Running water, Electricity, Flush Toilet, Colored TV, Stereo CD, Home Entertainment System, VCD/DVD Player, Electric range, Cooking range with oven, Microwave oven, Refrigerator, Freezer, Aircon, Electric fan, Water heater installation, Vacuum cleaner, Floor polisher, Washing machine, Family computer, Personal computer/Laptop, Car/Jeep/Van, Landline/Cellphone, Internet Connection. | |||||
| *Source: The American Association for Public Opinion Research. 2015. Standard Definitions: Final Disposition Codes and Outcome Rates for Surveys. | |||||
Significance test versus Average of the Remainder or Multiple Comparison Test was
used.
Formula: